

Data Visualization Services
Make Complex Data Easy To Understand
Interactive visual stories and dashboards that help teams explore trends and take action faster.
What Is Data Visualization?
Data visualization is the process of converting complex datasets into visual formats such as dashboards, charts, and reports that are easy to understand and interpret.
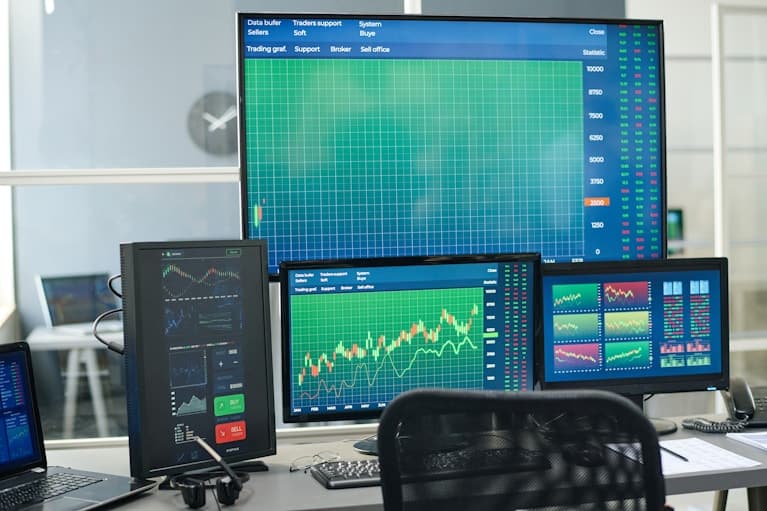
By transforming raw numbers into meaningful visual insights, businesses can identify trends, track KPIs, and make informed decisions faster and more confidently. Our solutions focus on clarity, accuracy, and performance — ensuring your data tells a powerful and actionable story.
Why Choose itechAlight for Data Visualization?
Purpose-built visual analytics for better decisions
Story-Driven Dashboards
We structure visuals around business questions so every chart has a clear decision outcome.
Executive-Friendly Reporting
High-level and drill-down views are designed for leadership reviews and daily operations.
Consistent KPI Definitions
Metrics are standardized across teams to avoid conflicting numbers and reporting confusion.
Interactive Filtering
Users can segment by region, product, customer type, and time period in seconds.
Cross-Platform Accessibility
Reports are optimized for desktop and mobile so your teams can monitor performance anywhere.
Secure Data Delivery
Access controls and governance ensure the right users see the right data every time.
What We Offer
Everything needed for modern visual reporting
Dashboard Design & Prototyping
Wireframed and production-ready layouts designed for readability and fast insight consumption.
Visualization Standardization
Reusable templates, chart libraries, and style systems for consistent reporting across teams.
Insight-Led Reporting
Context-rich visual reporting that highlights trends, risks, and opportunities clearly.
Get the latest industry insights delivered to you
Case Studies
Examples of decision-ready visual dashboards


Answers to Your Most Common Questions
Quick clarity before you start your visualization initiative

Data visualization focuses on presenting data visually, while BI includes broader analytics, governance, and decision workflows. Visualization is often a key part of BI.
Yes, we can modernize legacy reports and convert static outputs into interactive visual dashboards.
Most projects start with a 2 to 4 week phase for discovery, design, and first dashboard delivery.
Yes. We provide onboarding and usage training so business users can confidently use and interpret dashboards.
Yes, we support blended architectures and unified visualization layers across mixed environments.